
The first half of the year has been a tough period for equity markets around the world.
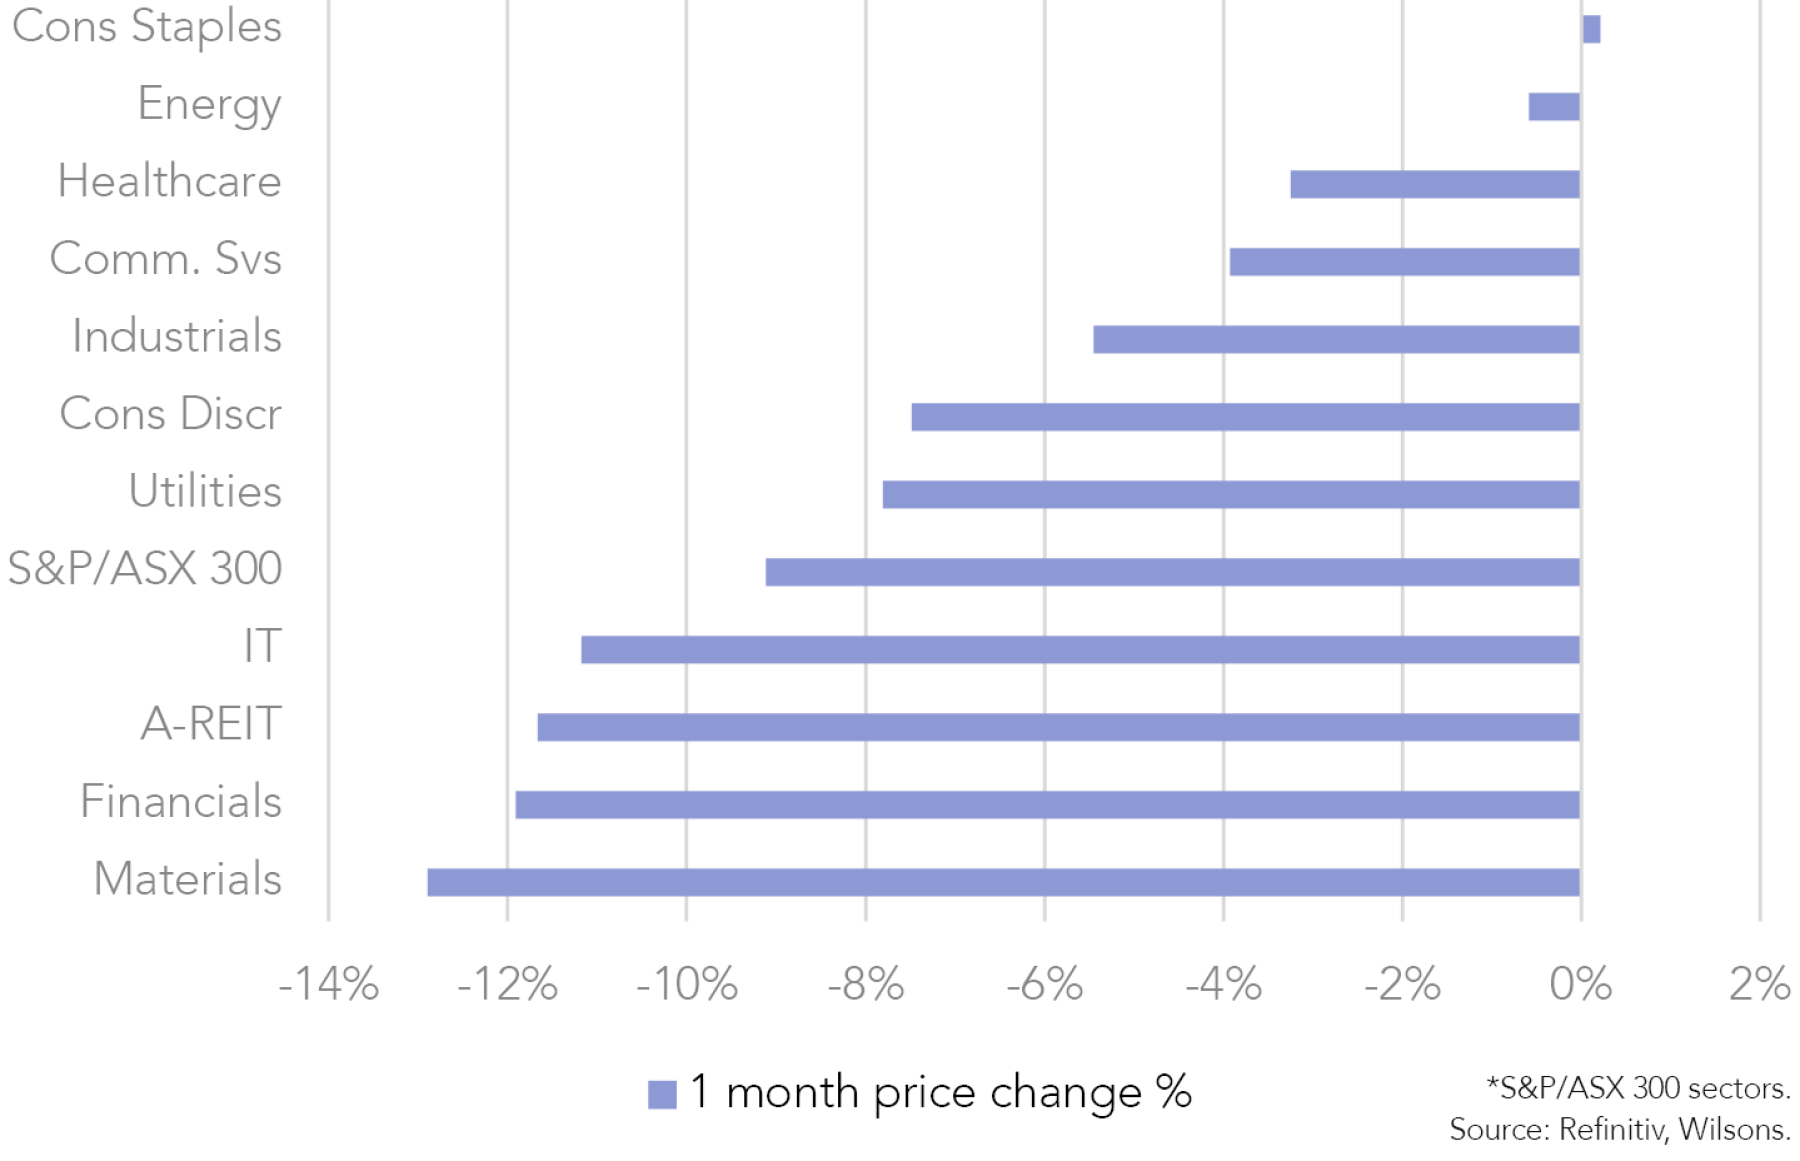
Investors continue to price in concerns on inflation and the increasing probability of a recession. The ASX 300 fell 9.1% in June compared to the MCSI World Index (A$), which fell 4.8% (-7.9% in local currency).
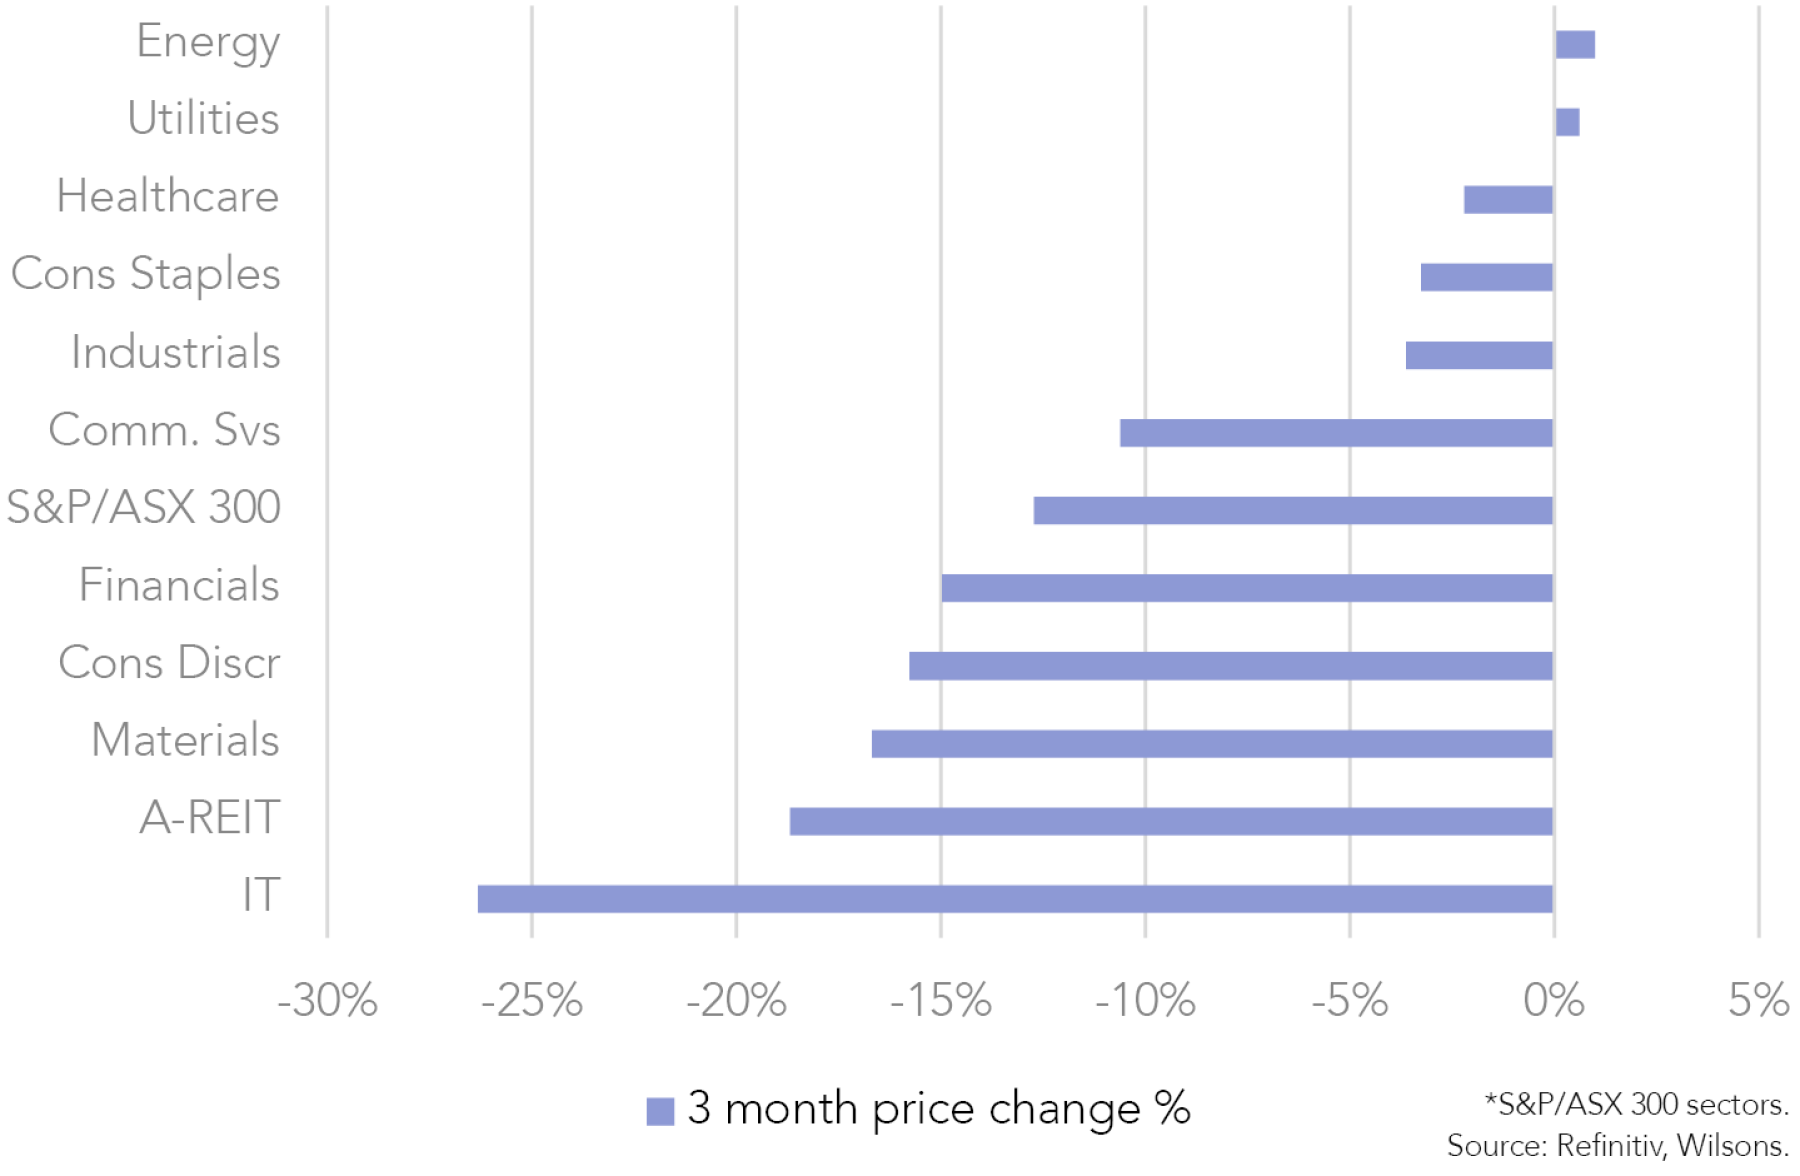
The materials and financials sectors took a heavy battering this month. This hurt the performance of the previously resilient Australian market. Commodity prices fell as recession fears increased concerns that demand could soften over the next 12 months. Financials, especially the banks, struggled after the RBA surprised the market and raised rates 50bps to a cash rate of 0.85%. Investors have seemingly become more concerned about bad debts and loan growth due to tighter monetary policy.
Tech continues to get pummelled. One of the worst sectors in the month and the worst sector in the last quarter. The recalibration of valuations are still taking their toll on these typically high growth stocks. A stabilisation of long bond yields could be a positive for growth stocks as the focus returns to earnings growth rather than valuations.
The typical defensive sectors like consumer staples and healthcare outperformed in the month as market concerns on both inflation and growth pushed investors to safe-haven equity sectors. We have previously discussed how we believe a shift towards quality defensives could be sensible.

From an individual stock perspective, the best performing ASX100 stocks in June were Tabcorp (TAH, 14.5%), Atlas Arteria (ALX, 12.1%) and Woodside Energy (WDS, 7.0%). The worst performers were Evolution Mining (EVN, -38.0%), Block Inc (SQ2, -28.2%) and Oz Minerals (OZL, -26.3%).
ISG Views for July
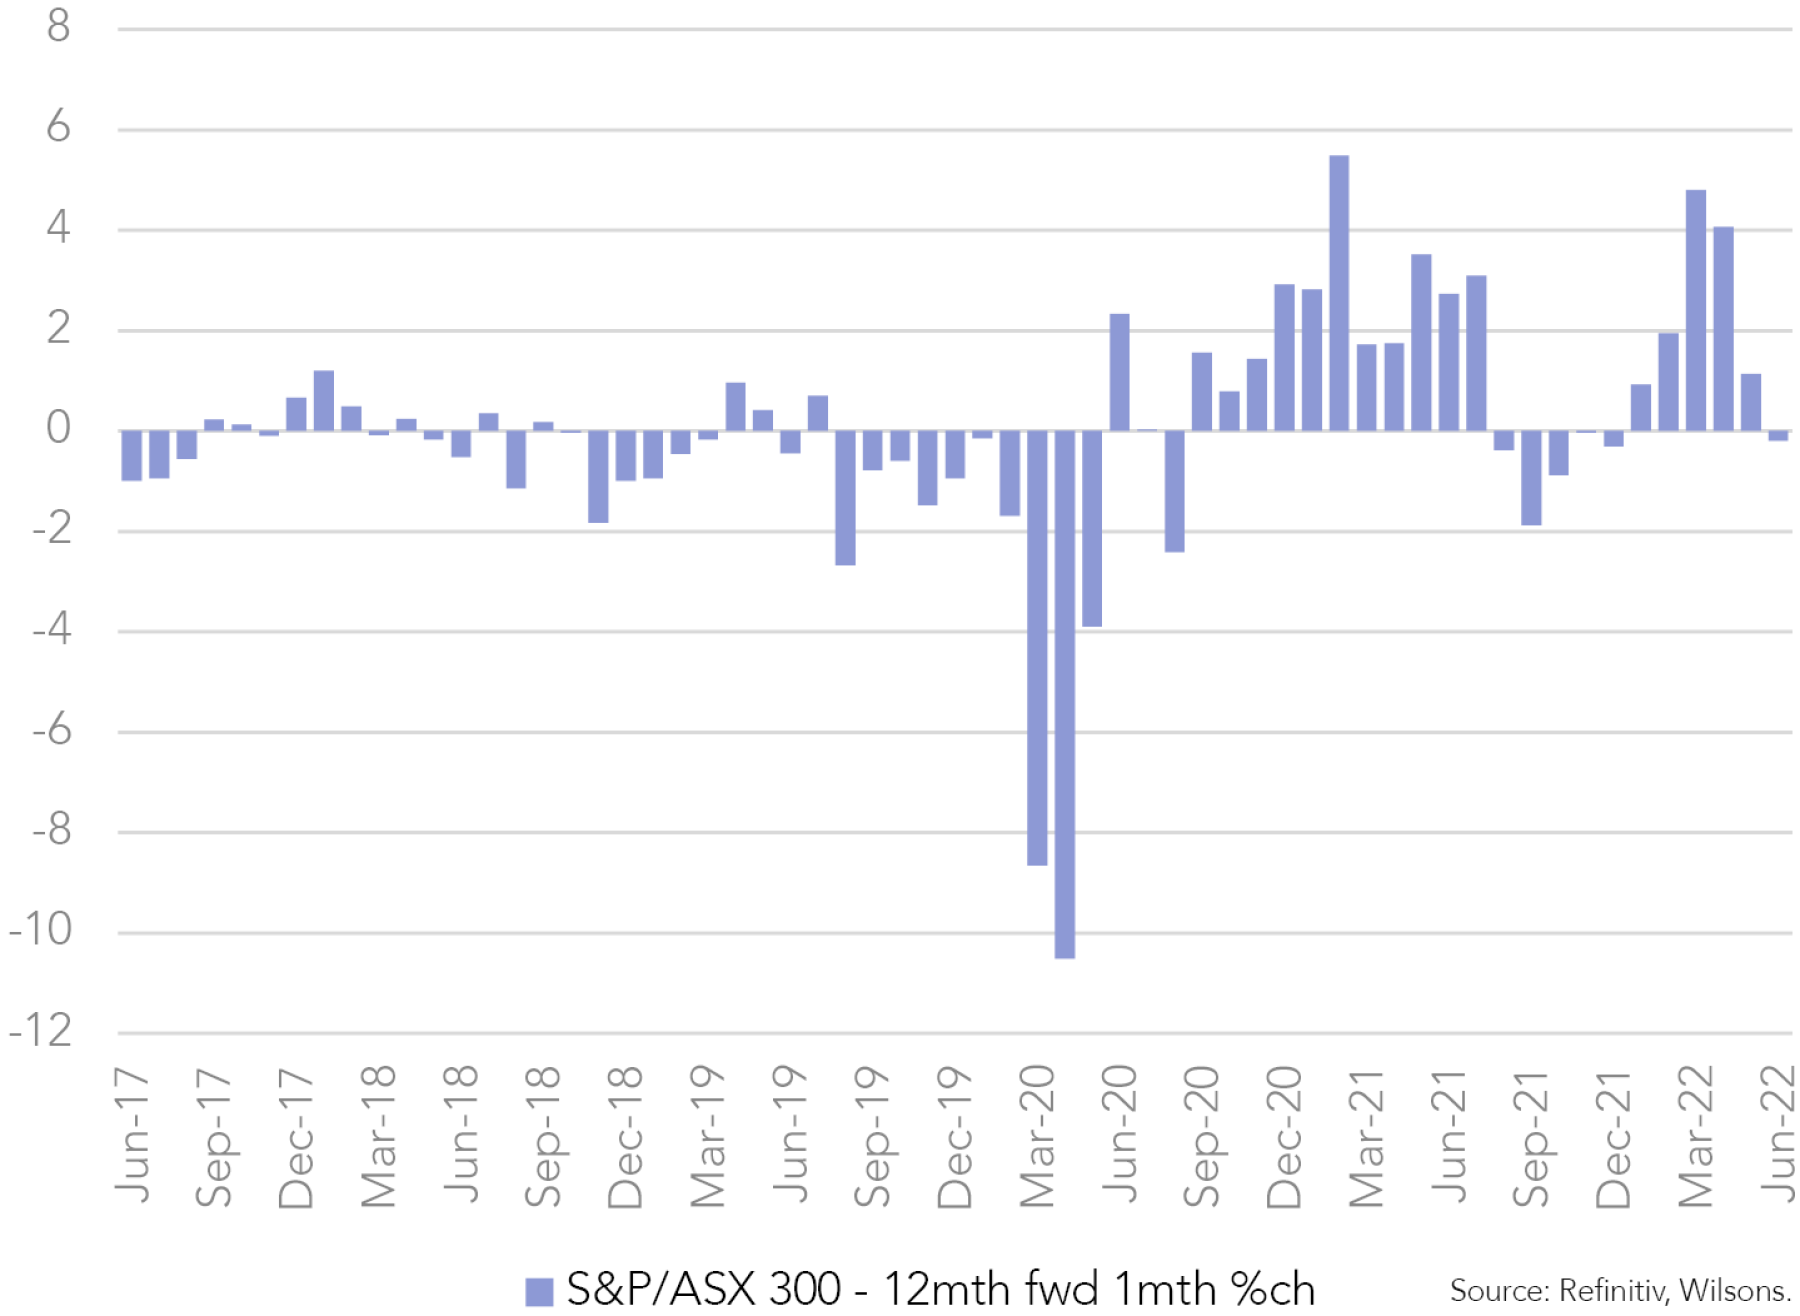
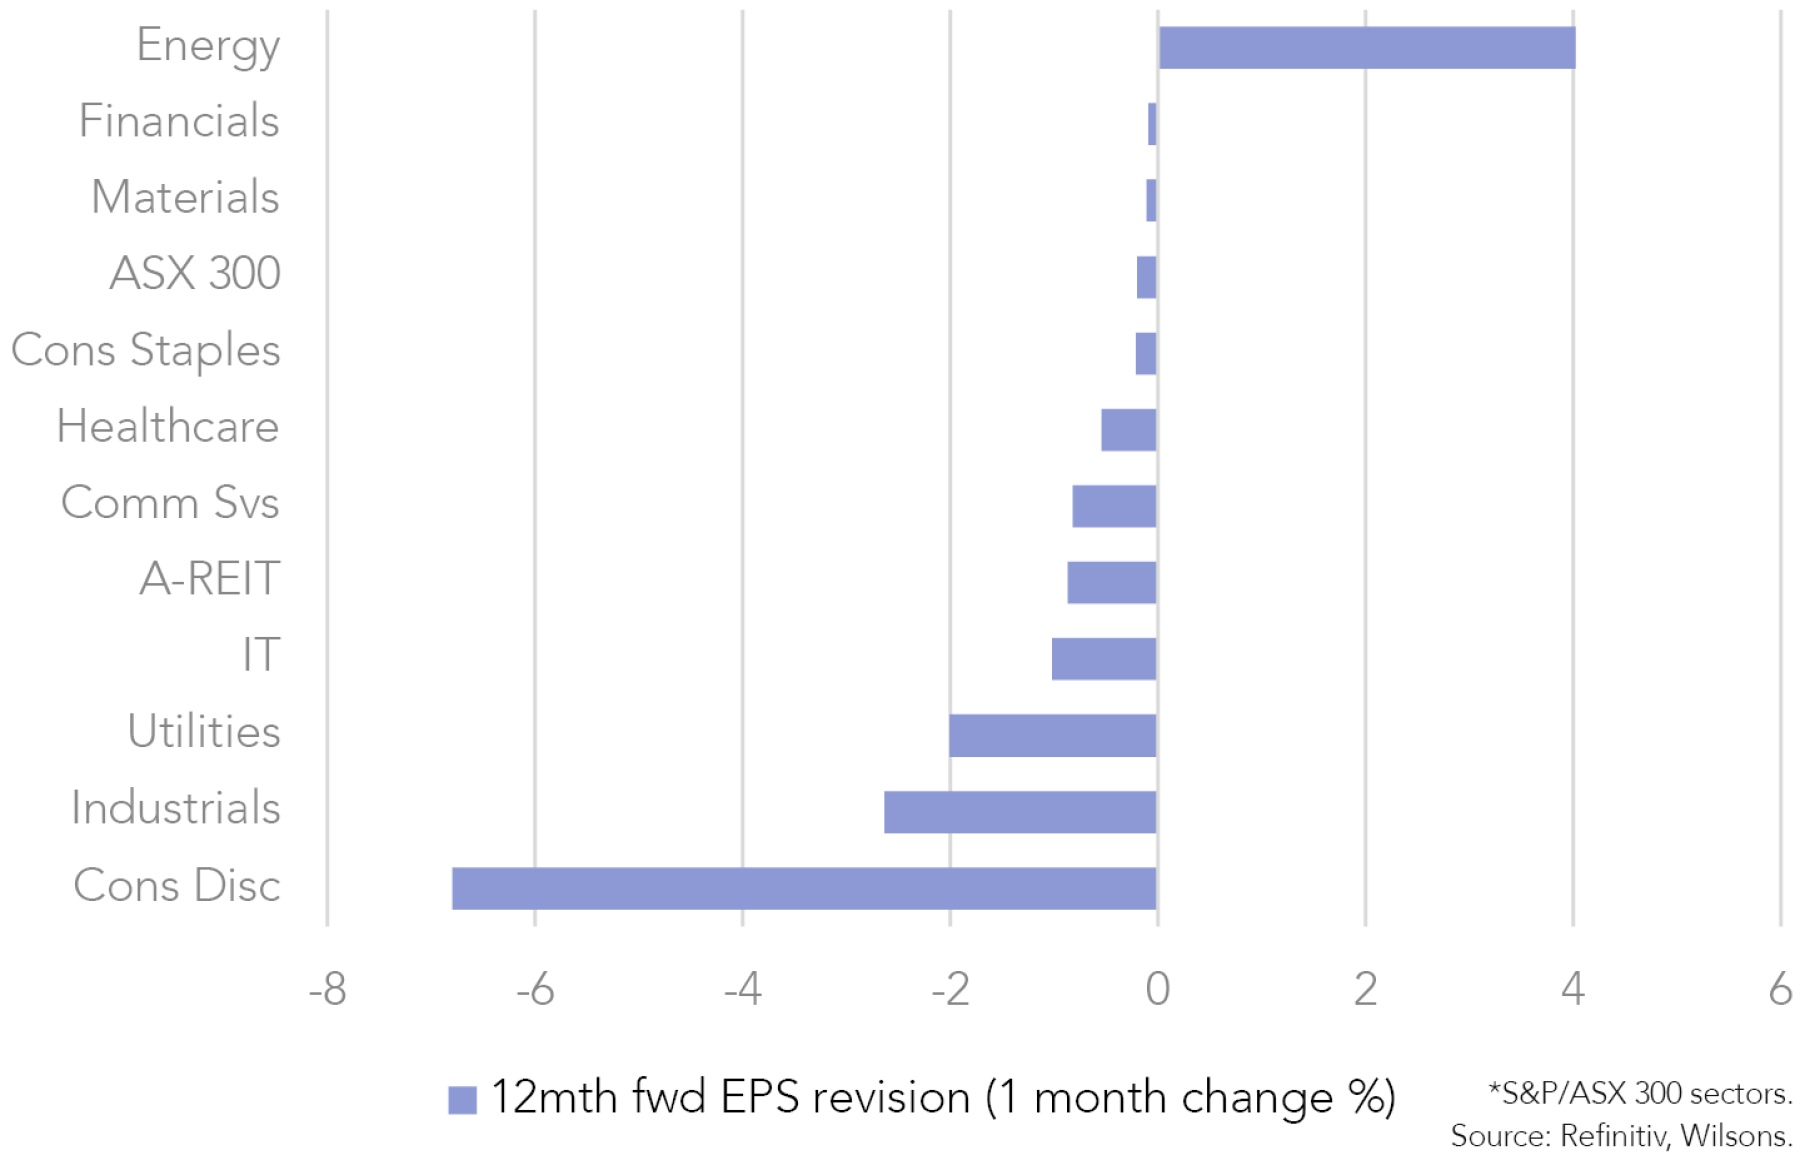
We have entered a more mature part of the cycle, with GDP likely continuing to slow (probably quite rapidly) from here. Investors will have to navigate a period where economic and earnings growth could be vulnerable to downward revisions. We have already seen a downward revision in the ASX 300 in June, and we think this will continue as we get closer to reporting season in August
Recession risk still rising
The risk of recession has increased over the past quarter, becoming one of the key risks for equity markets. We think that risks are likely to stay elevated as the market becomes more concerned about the growth outlook as the US Fed and RBA continue to hike rates rapidly over the next three months, putting pressure on already slowing economies.
To counter this above-trend volatility and as we enter a mature part of the cycle, we think it is prudent to balance the risk/return profile of the Focus List as uncertainty continues to bite.

Leave risk on the table
However, we still don’t think investors should get too bearish. It is worthwhile leaving some risk on the table. We believe there is a good chance that, despite a likely slowdown in growth, inflation (driven by the US) will start to ease, reducing the need for such sharp central bank tightening and reducing the perceived risk of a global recession. This could spark a rebound in equities as we move through the second half of the year.
Australia should be resilient to a global downturn
We believe Australia should be more resilient to a global economic downturn. Domestic growth is likely to slow, but the domestic economy should be relatively resilient given strong underlying momentum in the economy and the buffer from pent-up demand built up during COVID. This should provide some level of support for Australian equities over the next 12 months.
Market pessimism starting to look overdone
Our view is that the outlook is not as bleak as what the market has priced in. As a result, we believe that in the broadening market sell-off, investors now have a good opportunity to buy quality stocks that are well priced.
| Sectors | May Weighting | June Weighting | Market Weighting | Focus List Stocks | ISG View |
| Cyclical | |||||
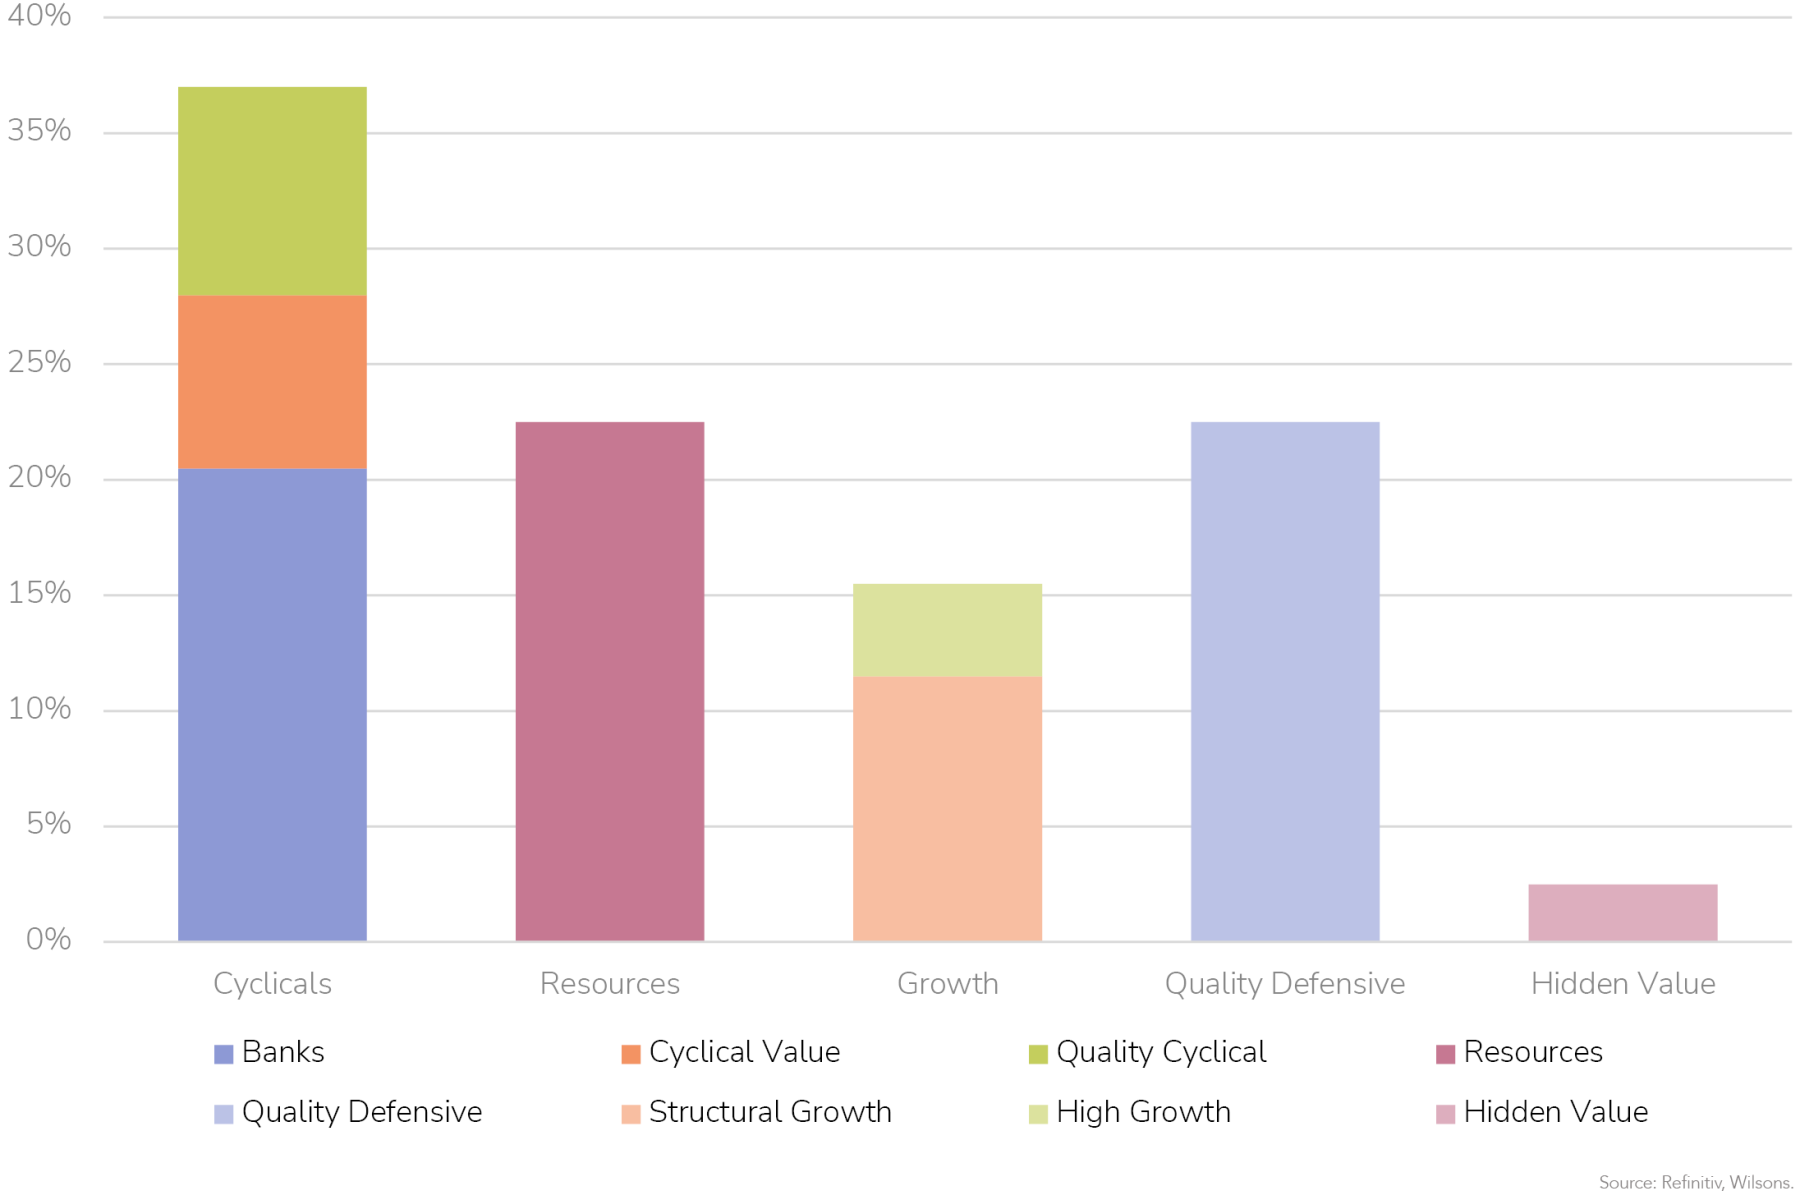
| Resources | 22.50% | 22.50% | 25.30% | BHP, STO, WDS, OZL, NST, AKE | The Focus List is underweight resources at a headline level, but this is predominately due to our weighting in iron ore focused miners rather than our weighting to other sub sectors. We like resources as an inflation hedge and protection against a longer than expected Russia/Ukraine conflict. China's COVID lockdowns have added some risk to iron ore demand in the short-term, but could lead to more Chinese stimulus in the next 12 months. We believe that more supply comes back online in 2H22 and this will lead to a lower price. Focus List is Overweight: Energy, Copper, EV minerals. Neutral: Gold Underweight: Iron Ore. |
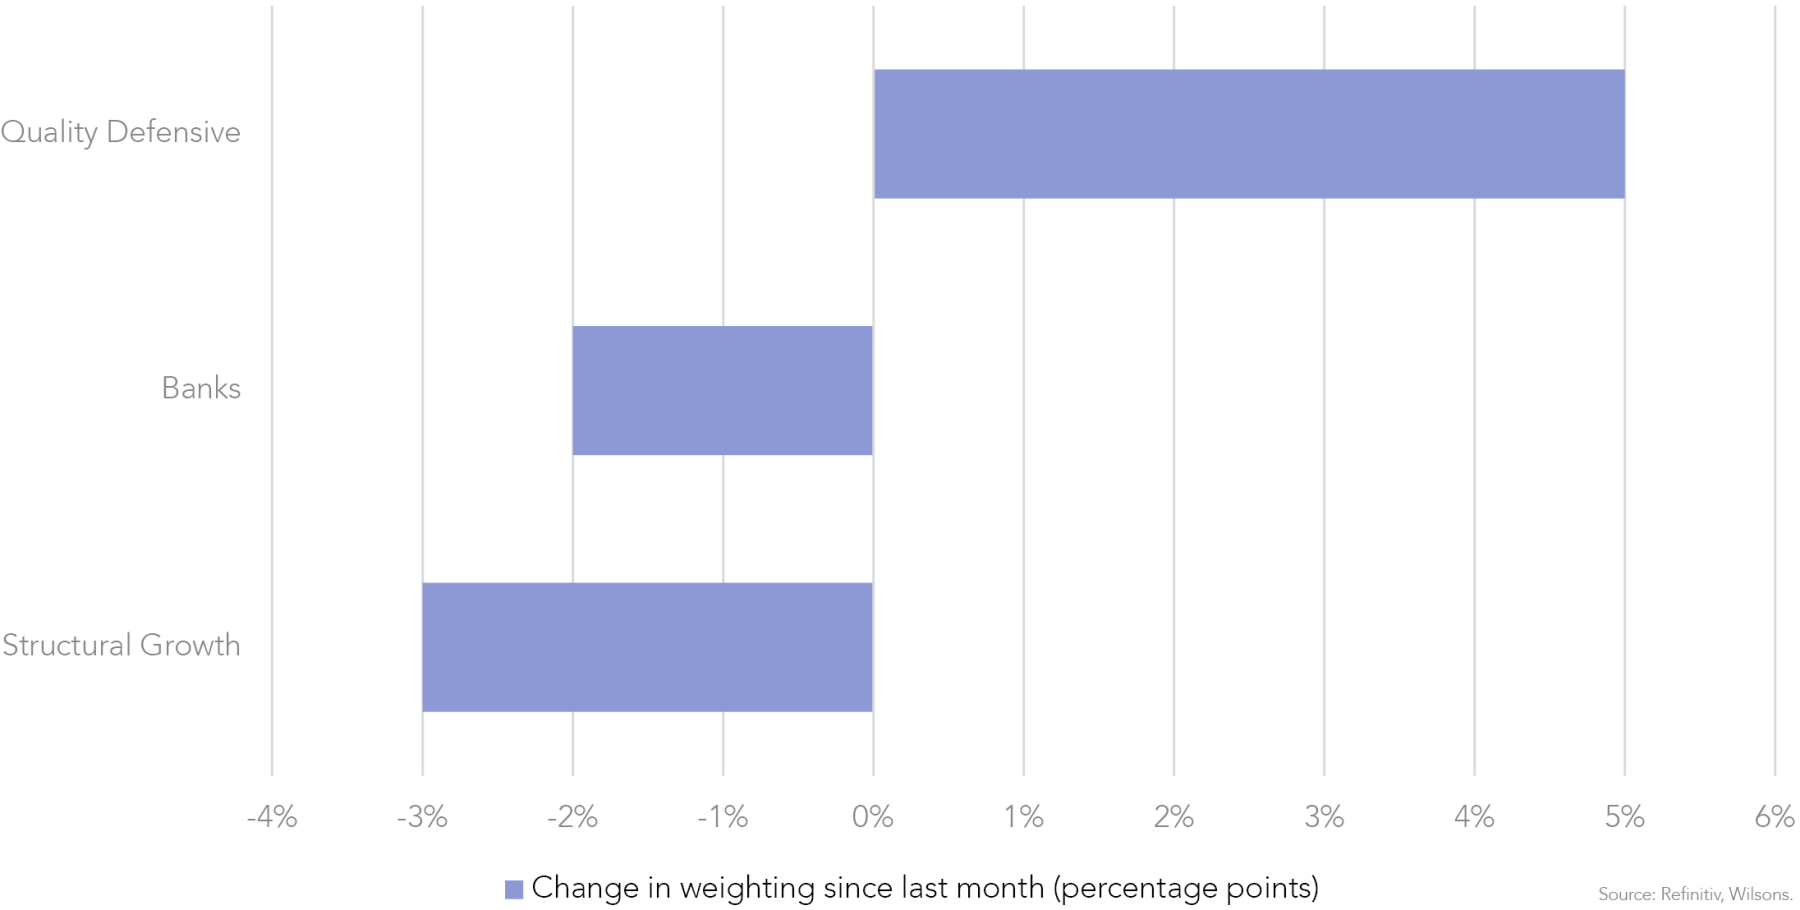
| Banks | 22.50% | 20.50% | 19.50% | NAB, WBC, ANZ, JDO | The Focus List moved to overweight the banks in May. We have trimmed this slightly in June by reducing our holding in Judo Bank (JDO). We believe that net interest margins (NIM) of the majors will grow faster than consensus forecasts, so keep our overweight. However, with the RBA increasing interest rates at such a lightening pace, we are concerned loan growth could slow substantially over the next 12 months. We trimmed JDO, the smallest bank in the Focus List, as we believe risks to the downside are increasing as it tries to build its book over the next few years – a recession or significant slowdown in the middle of the company trying to build its book would likely be a headwind for earnings and the stock price. |
| Cyclical Value | 8% | 7.50% | 8.30% | QAN, SVW, TAH | Resources and banks provide us a large allocation to these sectors but we also hold Qantas (QAN) and Tabcorp (TAH) (as COVID recovery plays) and Seven Group Holdings (SVW). While these stocks are cyclical, we believe the market is mispricing the earnings potential of these companies. For TAH, the wagering and media arm were negatively impacted by COVID-19, but these earnings should recover in the next 1-2 years, and we think this could lead to earnings upgrades. Now that the business is demerged, further bids may be made for the New Tabcorp (Wagering, Media and Gaming Services). Global betting company Entain (ENT.L) and private equity giant Apollo have both bid for TAH’s wagering business in 2021. Apollo offered $4bn for the wagering, media and gaming services businesses combined. The current market cap of TAH is ~$2bn, and therefore there seems to be a valuation gap to the bid’s pre-demerger. |
| Quality Cyclical | 9% | 9% | 8% | MQG, JHX | We believe these quality cyclicals will continue to generate high returns on capital at this point in the cycle, even though higher bond yields are putting pressure on valuations. Macquarie (MQG) and James Hardie (JHX) remain core holdings of the Focus List. While MQG and JHX will not be immune to an economic slowdown or a recession, we believe these companies can cover their costs of capital at the bottom of the economic cycle, a charactersitic we like when holding these stocks throughout the cycle. The earnings potential of both these stocks over the medium-term are potentially still underestimated by the market and both these stocks look like good buying opportunities in the recent sell-off. |
| Growth | |||||
| Structural Growth | 14.50% | 11.50% | 8.20% | ALL, GMG, SEK, PNI | The Focus List has a structurtal bias towards quality growth. We still hold these stocks as we believe they have a strong growth trajectory over the medium-term, but higher bond yields have heightened valuation pressure over the last 3-6 months. In our opinion, the growth stocks in the Focus List have been oversold over the past few months. The average 12mth fwd PE of these stocks is 20x, below the ASX industrials PE and therefore look reasonable value. US and Australian bond yields are likely at or very close to a peak, while our preferred growth exposures have tangible earnings growth prospects. |
| High Growth | 4% | 4% | 2% | XRO, TLX | We remain cautious on high-growth stocks that are likely to be highly volatile as the market adjusts to the current risks. Even though we believe some of these high-growth companies are excellent companies, we remain underweight from a valuation perspective until we have greater clarity on inflation and interest rates. |
| Defensives | |||||
| Quality Defensive | 18% | 22.50% | 29.40% | CSL, IAG, TLS, HCW, TLC, CWY | We currently have a preference for quality defensives. In a mid-late cycle, we prefer companies we believe will be resilient to the downside risks that are more prevalent in this part of the cycle. Additionally, given the level of uncertainty and volatility that is persistent in markets at the moment, we believe holding names that are less sensitive to the economy and rising rates to be a prudent decision. Our picks are healthcare, lotteries, insurance and telcos. We recently added Cleanaway (CWY) during the most recent sell-off. We think that you can still buy CWY, a stock with defensive characteristics and inflation protection, at a reasonable price. |
| Hidden Value | |||||
| Hidden Value | 3% | 2.50% | N/A | NWS | We are always on the lookout for stocks with hidden value. We find this subset of the portfolio can provide above-market returns that are less correlated to the rest of the market. News Corp (NWS) should have catalysts to highlight value to the market over the next 12 months. |
Source: Refinitiv, Wilsons.
Focus on Qantas (QAN)
Macro priced in
Australian travel stocks have been beaten up over the past month over concerns around economic slowdown and elevated energy prices. The emergence of recession risk as a potential threat to the travel recovery over the past month has taken QAN back 15%. We think QAN looks good value at current prices.
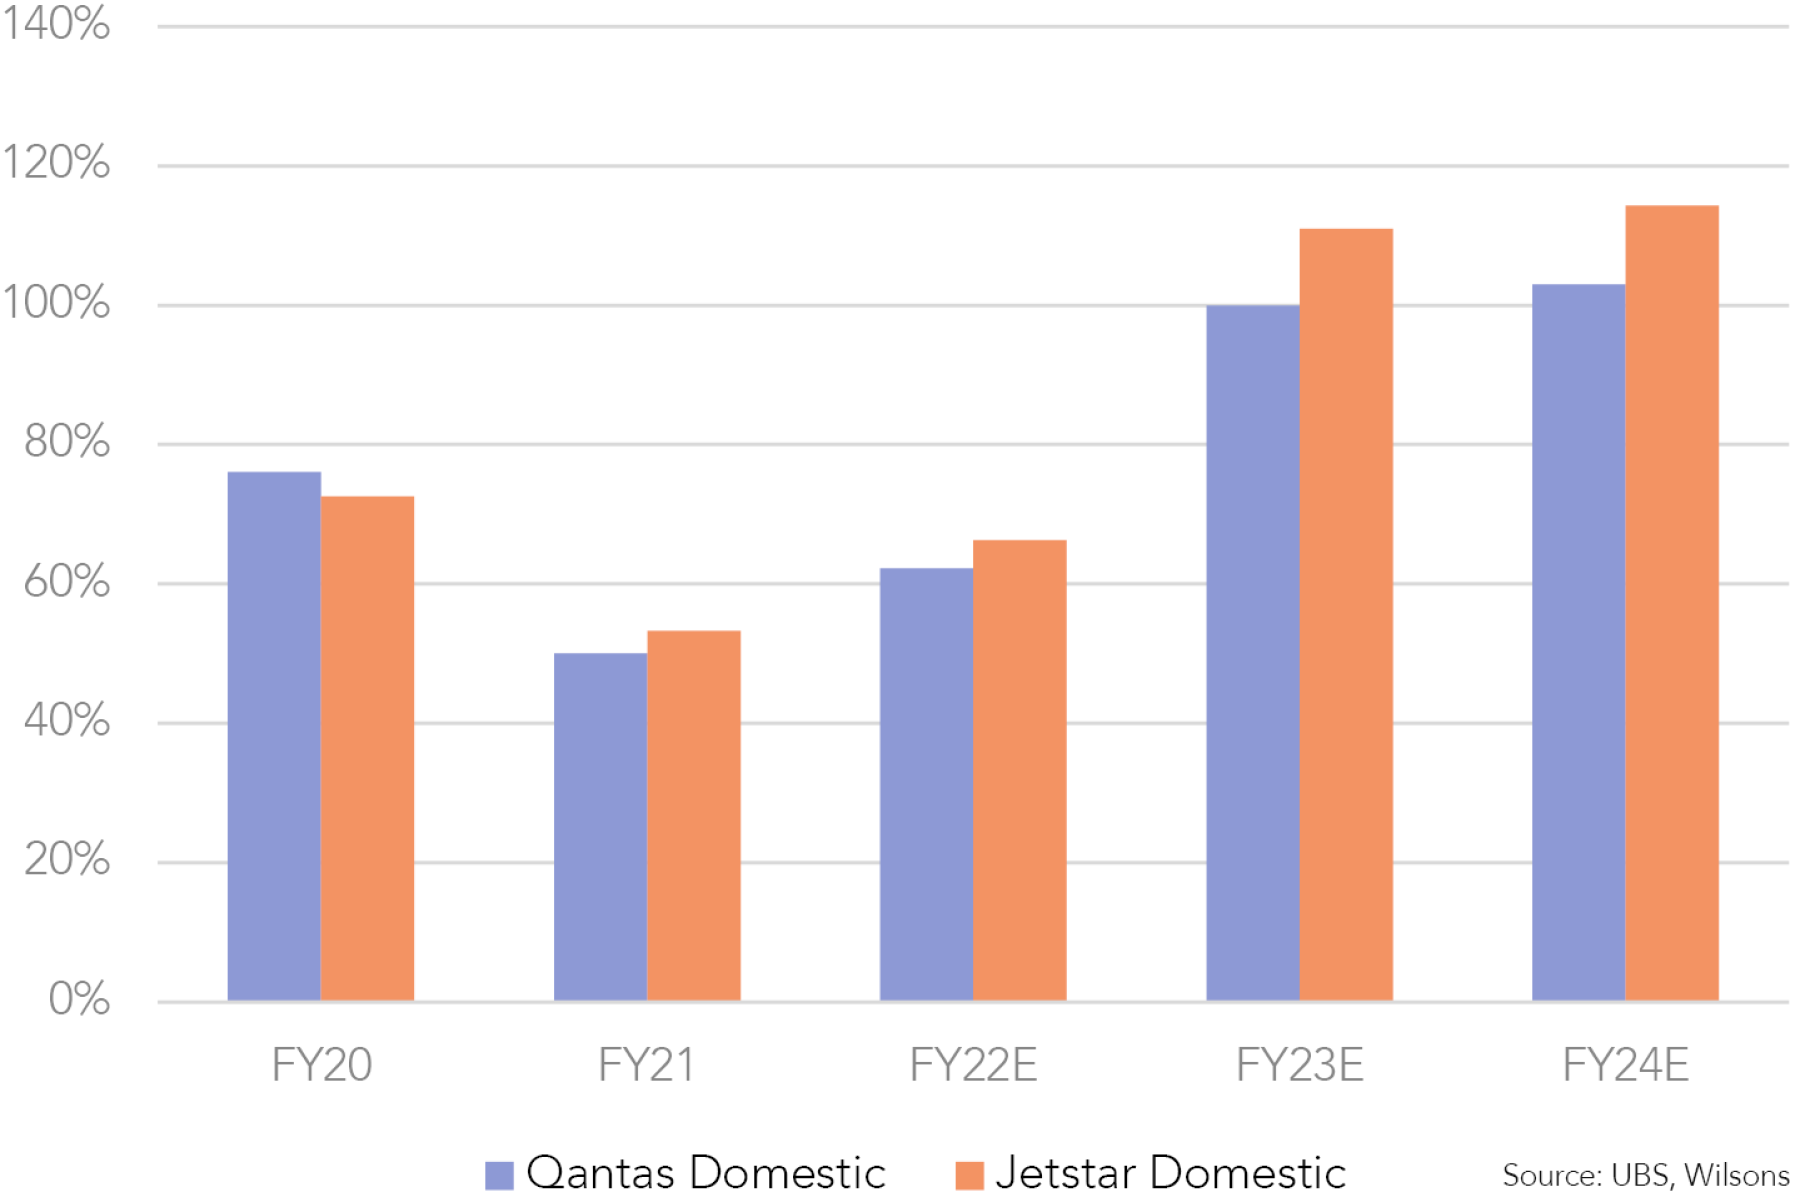
Despite QAN being a high beta stock, we believe near-term demand will be bolstered by pent-up leisure and corporate demand and outweigh the impacts of an economic slowdown. We think QAN will be more resilient to a decline in economic conditions with its leaner cost base, stronger balance sheet, and higher loyalty contribution than in previous cycles.
Earnings could be higher than consensus
The investment appeal of QAN is that future normalised earnings could be considerably higher than pre-COVID earnings by FY24/25E, as costs have been cut from the company during COVID. This would present considerable upside to market estimates.
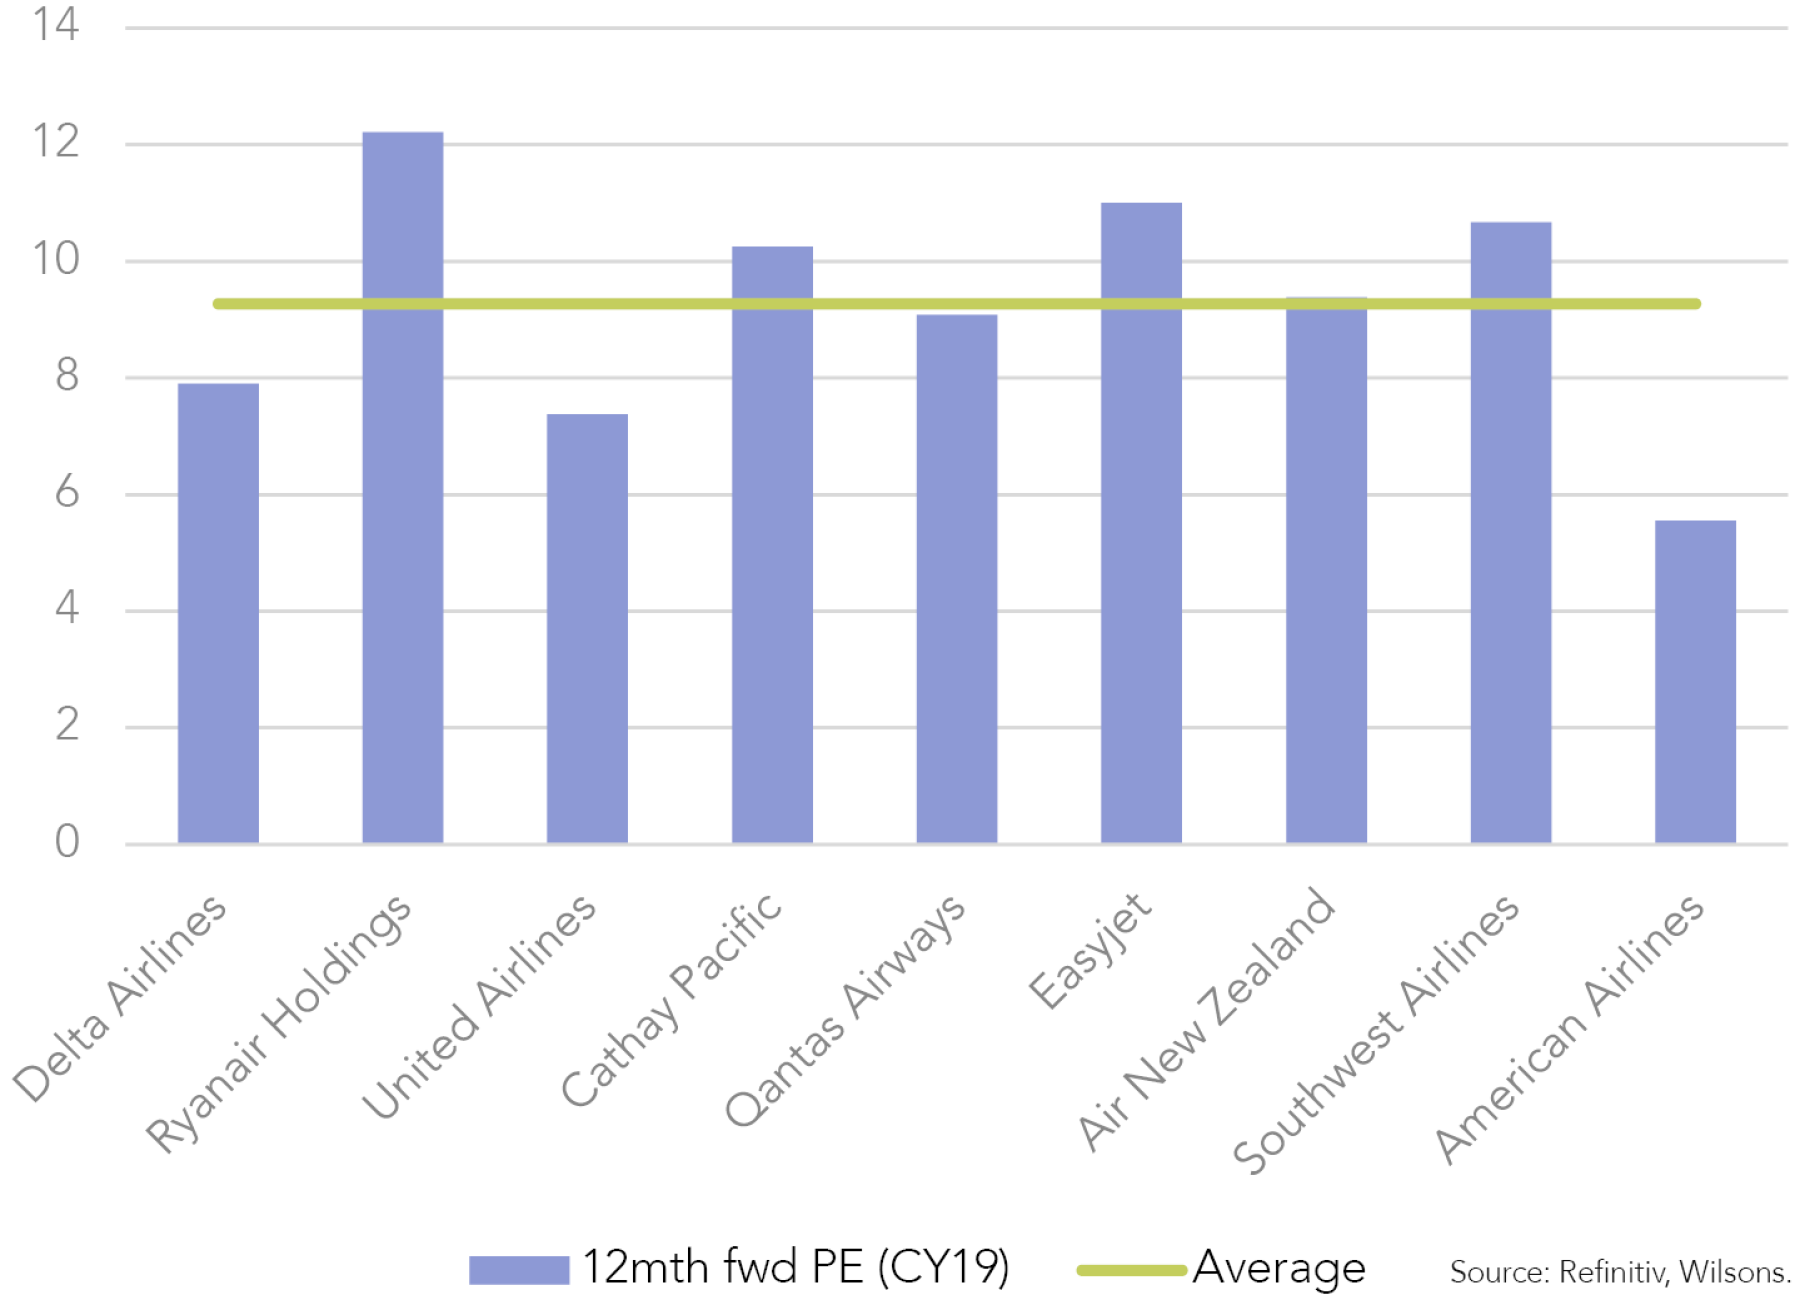
Valuation - QAN should be able to trade higher
We think the QAN PE multiple could be 10x – FY24 currently sits at 6x. If QAN can achieve consensus earnings of 0.68 in FY24 (which we think it can) then the stock should be priced at the end of June 2023 at $6.80 (using a 12mth fwd PE multiple of 10x). As the market gets more focused on the FY24 earnings over the next 12 months we think the stock can rerate towards this price target.
Quality Loyalty business undervalued
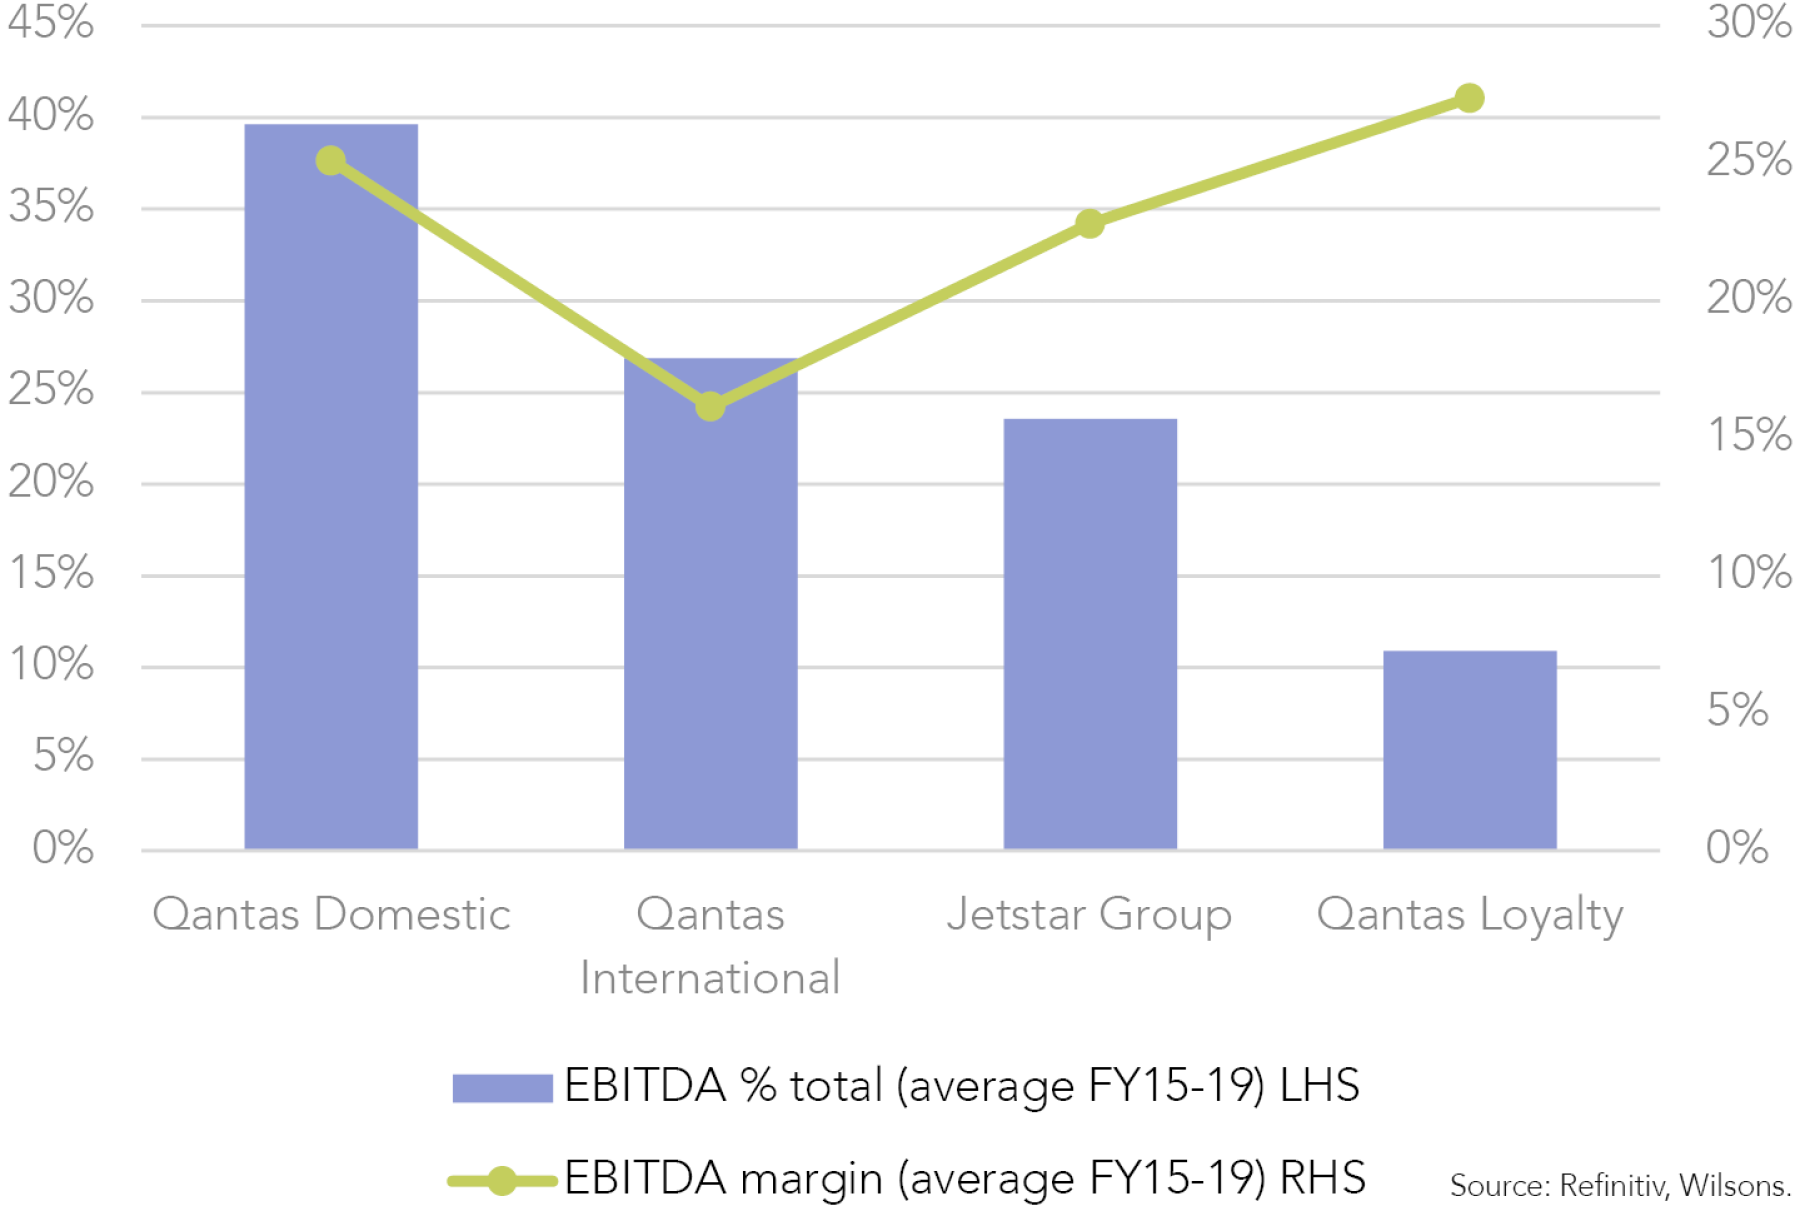
Qantas Loyalty and Frequent Flyer rewards program are the largest customer reward programs in the country with >12m members, capable of generating >$1.6bn in revenue per year. Loyalty business is not only highly strategic for QAN, but is extremely valuable, generating ~15% QAN earnings in normalised periods.
Importantly, the Loyalty earnings are somewhat immune from the aviation cycle, providing QAN with a counter cyclical earnings stream. In 2021, Loyalty was the only division to generate income. The Loyalty business generates most of its income by selling frequent flyer points to partner providers (>650 companies), which are then incorporated into their own reward programs. QAN sells these points at a margin above costs.
Loyalty as a standalone could attract an earnings multiple double that of the airline business given its growth profile and highly cash generative nature irrespective of the economic cycle. With listed loyalty programs now largely owned by investment firms or financial sponsors, valuation reference points are more challenging. We see QAN Loyalty as integral to QAN’s earnings and valuation going forward.
| Company Name | Ticker | Weighting | Share Price | Market Cap (A$b) |
Forecast Multiples | EPS | EPS | EPS | EPS CAGR % | Dividend Yield % | ROE | Net Debt/EBITDA | Consensus Recommendation Mean (5 = Strong Sell, 1 = Strong Buy) |
|
| 12mth fwd PE | 12mth fwd EV/EBITDA | FY1 | FY2 | FY3 | (FY1-FY3) | 12mth fwd | (FY1) | (FY1) | ||||||
| Communication Services | ||||||||||||||
| News Corp | NWS | 2.50% | 23.42 | 13.6 | 15 | 6.2 | 94% | 105% | 125% | 15% | 1% | 6% | 0.5 | 2 |
| Seek | SEK | 2.50% | 21.16 | 7.5 | 26.7 | 16.1 | 71% | 78% | 89% | 12% | 2% | 14% | 2.2 | 2.5 |
| Telstra | TLS | 3.00% | 3.89 | 44.9 | 23.1 | 7.8 | 14% | 17% | 18% | 14% | 4% | 11% | 1.6 | 2.2 |
| Consumer Discretionary | ||||||||||||||
| Aristocrat Leisure | ALL | 4.00% | 34.74 | 23.2 | 18.9 | 11.4 | 168% | 187% | 205% | 10% | 2% | 23% | -0.1 | 2.1 |
| Lottery Corporation | TLC | 3.00% | 4.57 | 10.2 | 26.6 | 13.4 | 16% | 17% | 18% | 6% | 3% | 152% | 3.1 | 2.4 |
| Tabcorp Holdings | TAH | 1.00% | 1.07 | 2.4 | 27.8 | 10.4 | 2% | 4% | 4% | 52% | 2% | 4% | 2 | 2.8 |
| Energy | ||||||||||||||
| Santos | STO | 4.00% | 7.45 | 25.3 | 6.4 | 4 | 86% | 74% | 61% | -16% | 5% | 19% | 0.5 | 2.1 |
| Woodside Energy Group | WDS | 3.00% | 31.26 | 59.4 | 7.1 | 4.8 | 334% | 279% | 239% | -15% | 9% | 23% | 0.3 | 2.1 |
| Financials | ||||||||||||||
| ANZ | ANZ | 5.00% | 22.28 | 62.3 | 10.2 | 209% | 221% | 236% | 6% | 7% | 10% | 2.6 | ||
| IAG | IAG | 3.00% | 4.33 | 10.7 | 14 | 9.9 | 19% | 31% | 33% | 30% | 6% | 8% | 2.4 | |
| Judo Capital Holdings | JDO | 1.00% | 1.27 | 1.4 | 20.7 | 1% | 6% | 10% | 222% | 0% | 1% | 1.8 | ||
| Macquarie Group | MQG | 6.00% | 167.15 | 64.1 | 15.3 | 27.8 | 1072% | 1128% | 1173% | 5% | 4% | 14% | 2.3 | |
| NAB | NAB | 8.50% | 27.74 | 88.5 | 12.2 | 211% | 231% | 241% | 7% | 6% | 11% | 2.5 | ||
| Pinnacle Investment Management Group | PNI | 1.00% | 7.4 | 1.5 | 16.8 | 15.3 | 40% | 44% | 50% | 12% | 5% | 23% | 0 | 2.2 |
| Westpac | WBC | 6.00% | 19.67 | 68.9 | 10.7 | 155% | 189% | 208% | 16% | 7% | 8% | 2.6 | ||
| Healthcare | ||||||||||||||
| CSL | CSL | 8.50% | 274.8 | 133.3 | 31.7 | 20 | 494% | 583% | 681% | 17% | 1% | 20% | 2.3 | 1.8 |
| Telix Pharmaceuticals | TLX | 2.00% | 4.74 | 1.5 | -17% | -1% | 18% | 0% | -89% | 2.9 | 1.5 | |||
| Industrials | ||||||||||||||
| Cleanaway Waste Management Ltd | CWY | 3.00% | 2.61 | 5.4 | 27.9 | 10.4 | 7% | 9% | 11% | 24% | 2% | 6% | 2.7 | 2.4 |
| Qantas Airways | QAN | 4.00% | 4.51 | 8.5 | 12.4 | 4.5 | -69% | 34% | 68% | 2% | -133% | 2.1 | ||
| Seven Group Holdings | SVW | 2.50% | 16.77 | 6.1 | 8.9 | 7.6 | 157% | 186% | 208% | 15% | 3% | 16% | 2.7 | 2 |
| Information Technology | ||||||||||||||
| Xero | XRO | 2.00% | 78.81 | 11.9 | 169.5 | 38.8 | 39% | 73% | 134% | 86% | 0% | 5% | -0.5 | 2.4 |
| Materials | ||||||||||||||
| Allkem | AKE | 2.00% | 10.12 | 6.5 | 6.7 | 4 | 52% | 103% | 100% | 38% | 0% | 16% | -0.6 | 2 |
| BHP Group | BHP | 8.00% | 39.9 | 203.5 | 431% | 376% | 281% | -19% | 7% | 44% | 0.1 | 2.3 | ||
| James Hardie | JHX | 3.00% | 33.62 | 15.1 | 13 | 8.8 | 172% | 185% | 196% | 7% | 4% | 46% | 0.5 | 1.9 |
| Northern Star Resources | NST | 2.50% | 7.06 | 8.2 | 14.3 | 4.3 | 28% | 49% | 57% | 42% | 4% | 4% | -0.1 | 1.7 |
| OZ Minerals | OZL | 3.00% | 17.58 | 5.9 | 12 | 5.8 | 140% | 152% | 132% | -3% | 2% | 12% | 0.6 | 2.3 |
| Real Estate | ||||||||||||||
| Goodman Group | GMG | 4.00% | 18.74 | 35 | 20 | 19 | 81% | 93% | 103% | 13% | 2% | 11% | 0.8 | 1.9 |
| Healthco Healthcare and Wellness REIT | HCW | 2.00% | 1.43 | 0.5 | 17.8 | 12.5 | 5% | 8% | 9% | 35% | 6% | 4% | 4.3 | 2.3 |
Source: Refinitiv, Wilsons.

Written by
David Cassidy, Head of Investment Strategy
David is one of Australia’s leading investment strategists.
About Wilsons: Wilsons is a financial advisory firm focused on delivering strategic and investment advice for people with ambition – whether they be a private investor, corporate, fund manager or global institution. Its client-first, whole of firm approach allows Wilsons to partner with clients for the long-term and provide the wide range of financial and advisory services they may require throughout their financial future. Wilsons is staff-owned and has offices across Australia.
Disclaimer: This communication has been prepared by Wilsons Advisory and Stockbroking Limited (ACN 010 529 665; AFSL 238375) and/or Wilsons Corporate Finance Limited (ACN 057 547 323; AFSL 238383) (collectively “Wilsons”). It is being supplied to you solely for your information and no action should be taken on the basis of or in reliance on this communication. To the extent that any information prepared by Wilsons contains a financial product advice, it is general advice only and has been prepared by Wilsons without reference to your objectives, financial situation or needs. You should consider the appropriateness of the advice in light of your own objectives, financial situation and needs before following or relying on the advice. You should also obtain a copy of, and consider, any relevant disclosure document before making any decision to acquire or dispose of a financial product. Wilsons’ Financial Services Guide is available at wilsonsadvisory.com.au/disclosures.
All investments carry risk. Different investment strategies can carry different levels of risk, depending on the assets that make up that strategy. The value of investments and the level of returns will vary. Future returns may differ from past returns and past performance is not a reliable guide to future performance. On that basis, any advice should not be relied on to make any investment decisions without first consulting with your financial adviser. If you do not currently have an adviser, please contact us and we would be happy to connect you with a Wilsons representative.
To the extent that any specific documents or products are referred to, please also ensure that you obtain the relevant disclosure documents such as Product Disclosure Statement(s), Prospectus(es) and Investment Program(s) before considering any related investments.
Wilsons and their associates may have received and may continue to receive fees from any company or companies referred to in this communication (the “Companies”) in relation to corporate advisory, underwriting or other professional investment services. Please see relevant Wilsons’ disclosures at www.wilsonsadvisory.com.au/disclosures.